'plotter' and 'logger': Cycle by Cycle Data Logging for Motor Controllers
Monday, January 29, 2018
Ever since I started writing motor control firmware I've been pursuing higher and higher data logging rates. Back in the days of printing floats over 115200 baud serial on an ATMega328 performance was pretty poor, but now that high-performance ARM devices are available with much better SPI and serial speeds and an order of magnitude more RAM, we can do some pretty cool things. The holy grail is to log relevant data at the switching frequency to some sort of large persistent storage; this gives us the maximum amount of information the controller can see for future analysis.
'logger'
logger is less of a program and more of a set of tricks to maximize transfer and write performance. These tricks include:
- Packed byte representation: this one should be pretty obvious; rather than sending floats we can send approximate values with 8 bits of resolution. While we no longer need commas or spaces between data points, it is important to send some sort of unique header byte at the start of each packet; without it, a dropped byte will shift the reading frame during unpacking and cause all subsequent data to become unusable. I use 0xFF (and clip all data values to 0xFE); if more metadata is required, setting the MSB's of the data values to zero gives us 127 different possible header packets at the expense of 1 bit of resolution. The latter method also gives us easy checksumming (the lower 7 bits of the header byte can be the packet bytes XOR'ed together); however, in practice single flipped bits are rare and not that significant during analysis; as it is usually obvious when a bit has been flipped - conversely, if your data is so noisy that you don't notice an MSB being flipped, you probably have other problems on your hands...
- Writing entire flash pages at once: this is incredibly important. SD cards (and more fundamentally, all NAND flash) can only be written to in pages, even if there is no filesystem. Writing a byte and writing a page take the same amount of time; on typical SD card, a page is 512 bytes, so buffering incoming data until a full page is received results in a 1-2 order of magnitude improvement in performance.
- Dealing with power losses: the above point about how important writing full pages is is actually somewhat facetious. Normally, filesystem drivers and drive controllers will intelligently buffer data to maximize performance, but this is contingent on calling fclose() before the program exits - not calling fclose() or fflush() will possibly result in no data being written to the disk. Having some kind of "logging finished, call fclose() and exit" button is not ideal; if an 'interesting' event happens we usually want to capture it, but in the event of a fault the the user is probably being distracted by other things (battery fire, rampaging robot, imminent risk of death) and is probably not thinking too hard about loss of data. The compromise is to manually call fflush() once every few pages to write save the log to disk without losing too much performance. Depending on the filesystem implementation you are using, data may be flushed automatically at reasonable intervals.
- Drive write latency and garbage collection: this is a problem that nearly sunk the SSD industry back in its infancy. Drives which are optimized for sequential transfer (early SSD's and all SD cards) typically have firmware with very poor worst case latencies. Having the card pause for half a second every few tens of megabytes is hardly a problem when the workload is a few 100MB+ sequential writes (photos, videos), but is a huge problem when the workload is many small 4K writes, as some of those writes will take orders of magnitude longer than the others to write. The solution is to keep a long (100 pages) circular buffer with the receiving thread adding to the end and the writing thread clearing page-sized chunks off of the tail. The long buffer amortizes any pauses during writing; as long as the average write speed over the entire buffer is high enough no data will be lost.
- Delta compression: I have not tried this, but in theory sending or writing (or both) packed differences between consecutive packets should yield a significant boost in performance by reducing the average amount of data sent. This should be true especially if the sample rate is high (so the difference between consecutive data points is small).
Here is a sample sending program which sends data in 9-byte packets (including header) from a 5KHz interrupt over serial, and here is the matching receiver which writes the binary logs to an SD card with some metadata acquired from an external RTC and IMU module.
'plotter'
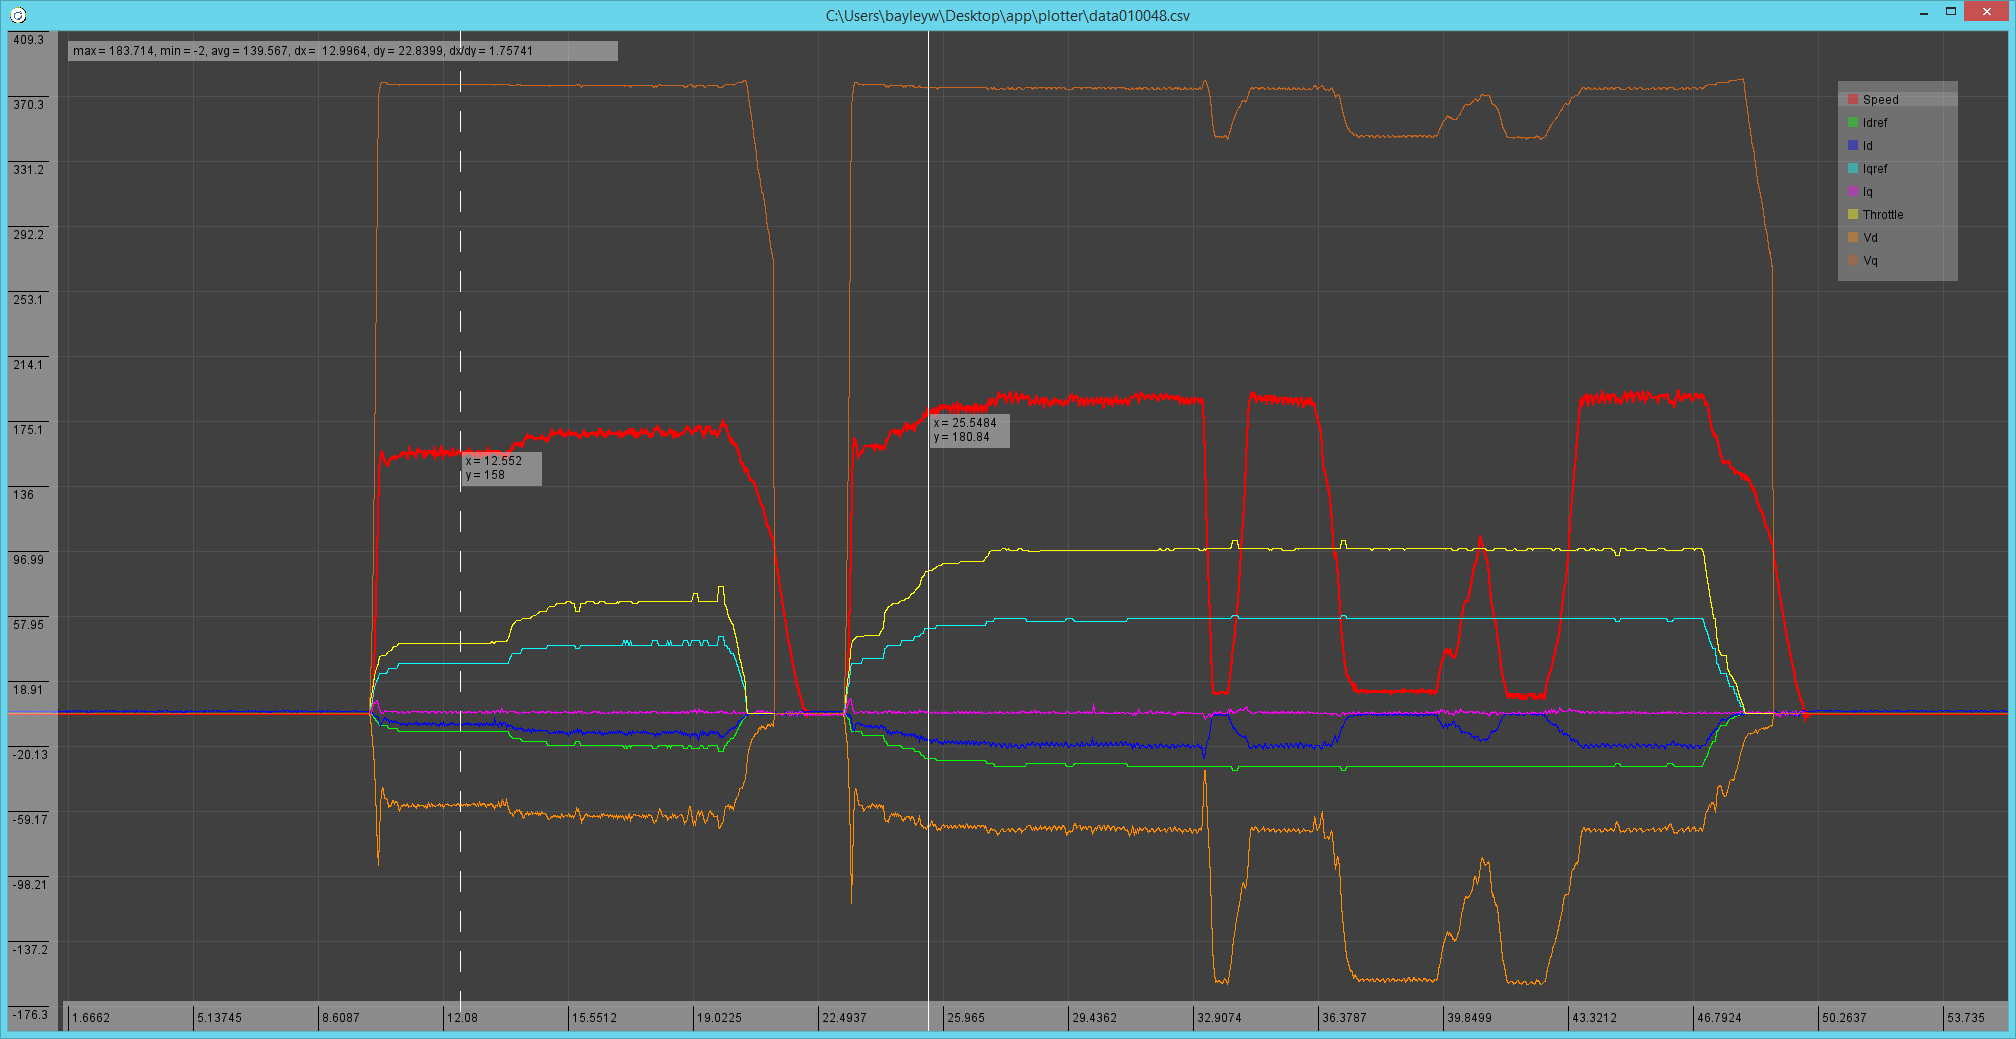
I wrote plotter after failing to find a data plotting application capable of dealing with very large data sets. Mathematica lacks basic features such as zooming and panning (excuse me? not acceptable in 2018!), Matlab becomes very slow after a few million points, and Plotly and Excel do all sorts of horrible things after a couple hundred thousand points.
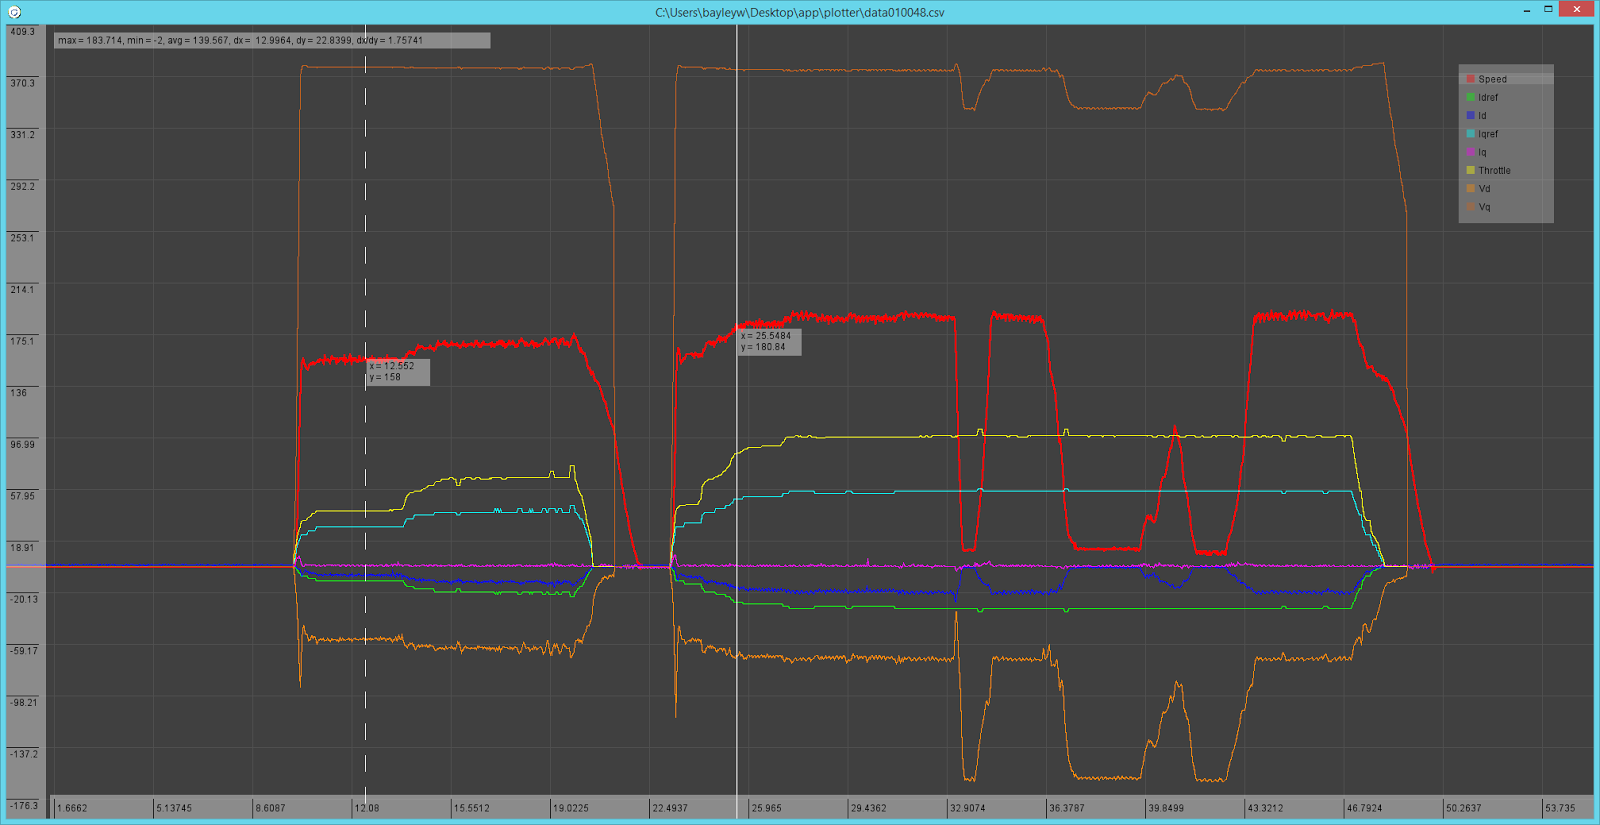
plotter uses a screen-space approach to drawing its graphs in order to scale to arbitrarily large data sets. Traces are first re-sampled along an evenly spaced grid (a sort of rudimentary acceleration structure). Then, at each column of the screen, y-coordinates are interpolated from the grid based on the trace-space x-coordinate of the column. Finally, lines (actually, rectangles) are drawn between the appropriate points in adjacent columns.
The screen-space approach allows performance to be independent of the number of data points, instead, it scales as O(w*n), where w is the screen width and n is the number of traces. It also guarantees that any lines drawn are at most two pixels wide, which allows for fast rectangle-based drawing routines instead of costly generalized line drawing routines (on consumer integrated graphics, the rectangles are several times faster than the corresponding lines). As a result, plotter is capable plotting hundreds of millions of data points at 4K resolutions on modest hardware.
For the sake of generality, the current implementation loads CSV files and internally operates on floating-point numbers. There's a ton of performance to be gained by loading binary files and keeping a 32-bit x-coordinate and a 8-bit y coordinate (which would lower memory usage to 5 bytes per point), but that comes at the expense of interoperability with other programs. The basic controls are:
- Cursors:
- Clicking places the current active cursor. Clicking on a trace toggles selection on that trace and puts the current active cursor there.
- [S] switches active cursor (and allows you to place the second cursor on a freshly opened instance of the program). If visible, clicking on a cursor switches to it.
- [C] clears all cursors.
- Traces:
- Clicking a trace toggles selection.
- Clicking on the trace's name in the legend toggles selection. This is useful and necessary when multiple traces are on top of each other.
- [H] hides selected traces, [G] hides all but the selected traces, and [F] shows all traces.
- Navigation:
- The usual actions: click and drag to zoom in on the selected box, scroll to zoom in centered around the cursor, middle click and drag to pan.
- Ctrl-scroll and Shift-scroll zoom in on the x and y-axes only, centered around the cursor.
- Placing the mouse over the x or y-axis labels and scrolling will zoom in on that axis only, centered around the center of the screen.
- File loading:
- plotter loads CSV's with floating point entries.
- The number of entries in the first row of the input file is used to determine the number of channels. From there on, extra values in rows are ignored, and missing values at the end get copied from the previous row.
- In Windows, drag a CSV onto the executable to open it. Note that this will cause the program to silently exit with no error information if the file is invalid.
- Configuration:
- plotter.txt contains the sample spacing (used to calculate derivatives and generate x-labels), the channel colors, and the channel names. If the config file is missing, all the traces will be black and the channel names will all be 'Test Trace'.
- The program will crash if arial.ttf is not in the program directory.
You can get a Windows binary here; source code will be uploaded once it is tweaked to work on Linux.